The Short, Exciting Life of a Viral Infographic
My first experience creating something that “went viral” came in December 2000, days after the Supreme Court ruled on Bush v. Gore, handing the White House to George W. Bush. Dismayed and bitter, I vented my irritation in a short, fake news story with the headline “BREAKING NEWS: God Overrules Supreme Court Verdict” The subhead: “Bush to be smote later today.” I emailed it to a few friends, then posted it on a forum for Madden video game players.
Within days, it had spread across the Internet. Soon after it left my desk, I lost any attribution as the source — it was commonly attributed to “author unknown” — and became an anonymous bit of short-lived viral Internet humor. A friend who worked for a Senator told me that it was buzzing around inboxes all over Capitol Hill. Filmmaker Michael Moore featured it on his web page as the “daily message” and emailed it to hundreds of thousands of his fans. Somewhere along the way, somebody copyedited it and corrected my subhead, replacing “smote” with “smitten.” It was re-posted on thousands of newsgroups and forums. It was translated into Spanish, German, and Japanese. Several friends forwarded it to me, not knowing that I was the author. It literally went around the world, popping up on millions of computer screens, then came back to my inbox.
I learned two things from that experience.
First, make sure your name appears on your work, or no one will know what you created.
Second, it’s impossible to predict when something will blow up on the Internet.
Most content lands with a thud. Most web jokes flop. Most blog posts are never read. Anyone who promises that they can make something “go viral” is lying.
In the years that followed, much of my professional life focused on the Internet: email marketing, web design, online activism, interactive design. Generally, you bat for the average on the web: some content does well, some doesn’t, but you work to build a steady growth in traffic or to reach a particular audience. You’re just trying to get on base.
But every once in a while, you take a swing and something flies out of the ballpark.
My most recent “viral” success came last year at my day job with this infographic. It started as a simple request from an economic policy expert who wanted to compare proposed federal budget cuts with existing tax breaks. She brought me an overwhelming five-page spreadsheet with 50 rows of numbers. If you dug through the dense data, you could see the comparisons, it took a lot of focus and concentration.
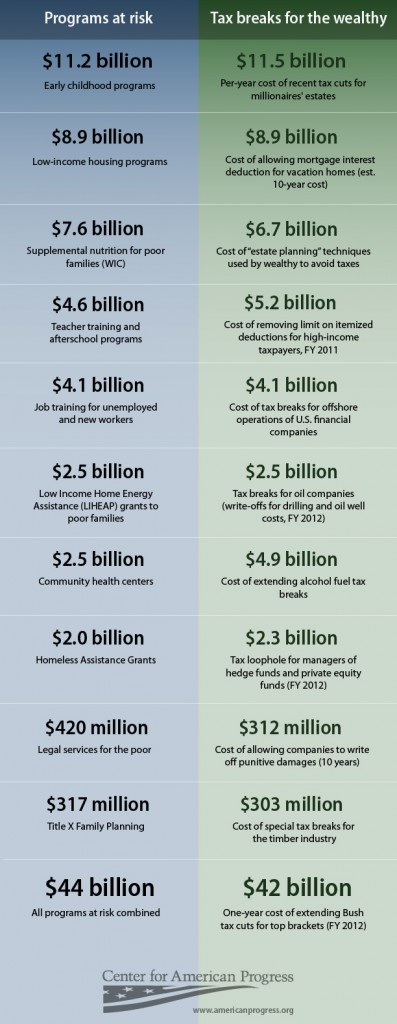
I suggested that we cut the data down to ten or fewer comparisons, and rather than comparing items based on topic, compare them based on value. In other words, we didn’t need to compare a transportation budget cut with a transportation tax break; what we wanted to show was the choice being made between budget items with a similar price tag. That choice would show the priorities and the ideology behind the budget, and say something about the people who pushed for it. My client agreed, and so I created a very simple side-by-side comparison table, focusing on a clean, readable design, something people could understand at a quick glance. We gave it a somewhat uninspired headline: “Infographic: Tax Breaks vs. Budget Cuts”
Here’s what it looked like:
We posted it on Tuesday, February 22. At first, it gathered good traffic, but nothing prenomenal. But a couple weeks later, someone called “greywolf359” posted it on a Daily Kos diary with the headline “The Must See Chart (This is What Class War Looks Like).” That post sparked 133 comments and was “liked” on Facebook more than 11,000 times and tweeted more than a thousand times. That same day, someone spotted the DailyKos post and re-posted the graphic on posterous.com with the same headline. This post was the one that really exploded: it was viewed more than 1.1 million times, generated nearly 500 comments, was tweeted 1,325 times, and was liked on Facebook 104,000 times. Two days later, Andrew Sullivan at the Atlantic made it his “Chart of the Day,” adding his short note: “You don’t have to be a flaming Marxist to see that there’s something askew here.” All this buzz drove traffic back to our original post, generating more than 200,000 page views, making it the single most popular item on our web site for 2011.
In the end, this little graphic that I only spent a couple hours on was viewed by millions of people, sparked debates and arguments across the web, and, most importantly, advanced our argument to a wide audience. This graphic hit the web long before the start of the Occupy movement and the 99% protests; it attempted to re-focus the public debate from a narrow focus on budget cuts to a bigger question of national priorities. We wanted to show that it wasn’t just about cutting spending, but also about reconsidering tax breaks that benefited the wealthy.
A cocktail of chaos and boredom fuels the Internet; it’s hard to foresee what will spread exponentially. Most often, stuff that goes viral does so by luck more than by design. That said, a few things helped us with this graphic that can inform designers.
First, the graphic was simple. We showed a lot less information than the client originally wanted. We also edited all the text down to the most minimal labels. The result made this easily skimmable; a chart you could read and understand within a minute.
Second, a clear message drove the design: our argument was that the proposed GOP budget cuts were unfair choices when weighed existing existing tax breaks. Each line showed a choice available to lawmakers when they considered a new budget: safety-net programs that benefit large groups of people or tax breaks that help the richest Americans. We hoped the comparisons would alarm and infuriate people, and, by all the evidence, it looks like they did.
Third, the graphic was credible. This wasn’t a piece of political propaganda. Every number was sourced and verified: we used no “fuzzy math” or statistical trickery to build this infographic. People could — and did — disagree with our take on the numbers, what they meant, and whether or not our arguments are valid, but we wanted the facts to be irrefutable.
The infographic didn’t move. It had no animated rollovers. It didn’t even have any graphics, other than some color and a few lines. It had good content and a design that didn’t get in the way. And that, as much any thing else, is a formula for a viral hit.